Fichier:Jordan illustration.png
Taille de cet aperçu : 634 × 599 pixels. Autres résolutions : 254 × 240 pixels | 508 × 480 pixels | 812 × 768 pixels | 1 064 × 1 006 pixels.
Fichier d’origine (1 064 × 1 006 pixels, taille du fichier : 55 kio, type MIME : image/png)
Ce fichier et sa description proviennent de Wikimedia Commons.
| Description |
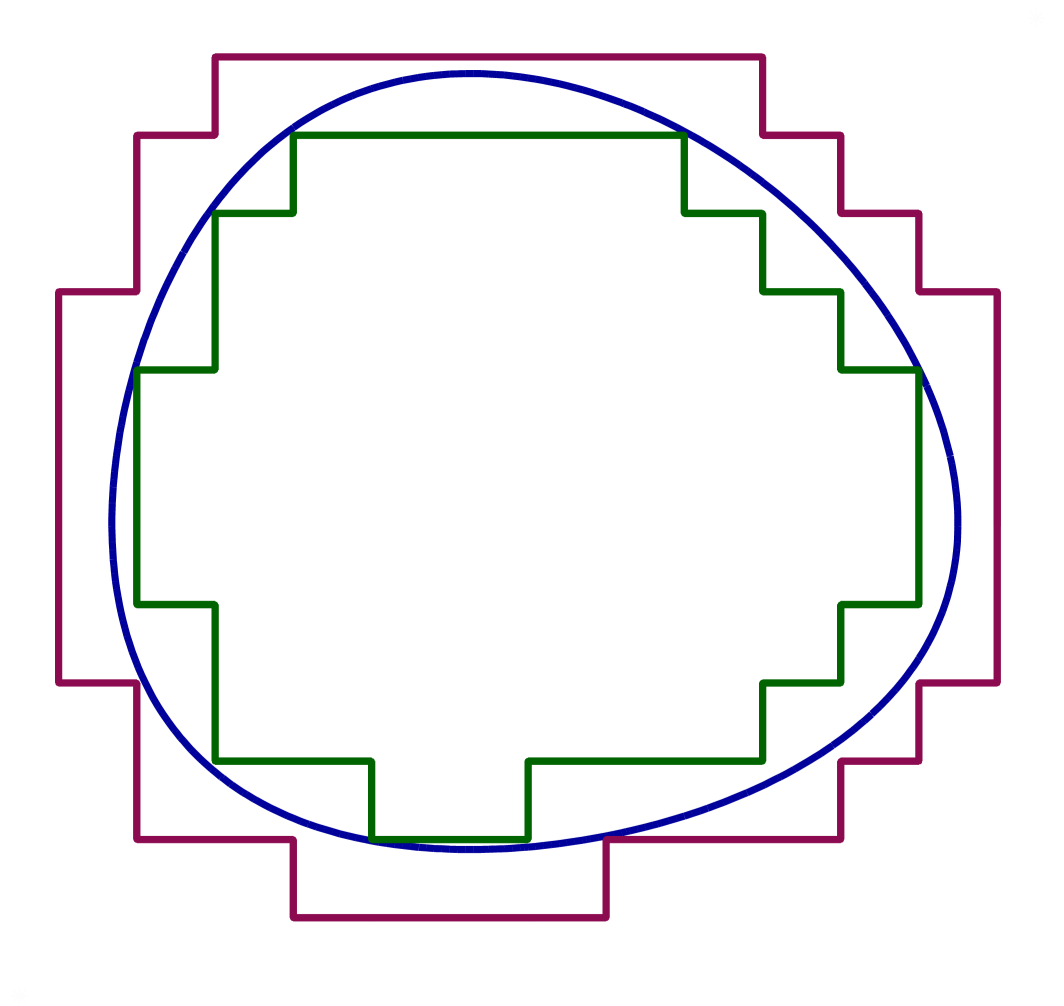
English: A set (represented in the picture by the region inside the blue curve) is Jordan measurable if and only if it can be well-approximated both from the inside and outside by simple sets (their boundaries are shown in dark green and dark pink respectively). |
| Date | |
| Source | Travail personnel |
| Auteur | User:Oleg Alexandrov |
Description
Made by myself with Matlab.
| Moi, propriétaire des droits d’auteur sur cette œuvre, la place dans le domaine public. Ceci s'applique dans le monde entier. Dans certains pays, ceci peut ne pas être possible ; dans ce cas : J’accorde à toute personne le droit d’utiliser cette œuvre dans n’importe quel but, sans aucune condition, sauf celles requises par la loi. |
Conditions d’utilisation
| Moi, propriétaire des droits d’auteur sur cette œuvre, la place dans le domaine public. Ceci s'applique dans le monde entier. Dans certains pays, ceci peut ne pas être possible ; dans ce cas : J’accorde à toute personne le droit d’utiliser cette œuvre dans n’importe quel but, sans aucune condition, sauf celles requises par la loi. |
Source code (MATLAB)
function main()

   % the function whose zero level set and inner and outer approximations will be drawn
   f = inline('60-real(z).^2-1.2*imag(z).^2-0.006*(real(z)-6).^4-0.01*(imag(z)-5).^4', 'z');

   M=10; i=sqrt(-1); lw=2.5;
   figure(1); clf; hold on; axis equal; axis off;

   if  1==0
      for p=-M:M
	 for q=-M:M
	    z=p+i*q;
	    if f(z)>0
	       plot(real(z), imag(z), 'r.')
	    else
	       plot(real(z), imag(z), 'b.')
	    end
	 end
      end
   end

% draw the zero level set of f
   h=0.1;
   XX = -M:h:M; YY = -M:h:M;
   [X, Y] = meshgrid (XX, YY); Z = f(X+i*Y);
   [C, H] = contour(X, Y, Z, [0, 0]);
   set(H, 'linewidth', lw, 'EdgeColor', [0;0;156]/256);

% plot the outer polygonal curve
   Start=5+6*i; Dir=-i; Sign=-1;
   plot_poly (Start, Dir, Sign, f, lw, [139;10;80]/256);

% plot the inner polygonal curve
   Sign=1; Start=4+5*i;
   plot_poly (Start, Dir, Sign, f, lw, [0;100;0]/256);

%  a dummy plot to avoid a matlab bug causing some lines to appear too thin
   plot(8.5, 7.5, '*', 'color', 0.99*[1, 1, 1]);
   plot(-4.5, -5, '*', 'color', 0.99*[1, 1, 1]);

   saveas(gcf, 'jordan_illustration.eps', 'psc2');

function plot_poly (Start, Dir, Sign, f, lw, color)

   Current_point = Start;
   Current_dir   = Dir;

   Ball_rad = 0.03;

   for k=1:100

      Next_dir=-Current_dir;

      % from the current point, search to the left, down, and right and see where to go next
      for l=1:3
	 Next_dir = Next_dir*(Sign*i);

	 if Sign*f(Current_point+Next_dir)>=0 & Sign*f(Current_point+(Sign*i)*Next_dir) < 0
	    break;
	 end
      end

      Next_point = Current_point+Next_dir;

      plot([real(Current_point), real(Next_point)], [imag(Current_point), imag(Next_point)], 'linewidth', lw, 'color', color);

      round_ball(Current_point, Ball_rad, color'); % just for beauty, to round off some rough corners

      Current_dir=Next_dir;
      Current_point = Next_point;

   end


function round_ball(z, r, color)
   x=real(z); y=imag(z);
   Theta = 0:0.1:2*pi;
   X = r*cos(Theta)+x;
   Y = r*sin(Theta)+y;
   Handle = fill(X, Y, color);
   set(Handle, 'EdgeColor', color);

|
Cette image (de type math) devrait être recréée dans un format vectoriel, en tant que fichier SVG. Cela offrirait plusieurs avantages : voir Commons:Media for cleanup pour plus d'informations. Si une version SVG de cette image est déjà disponible, merci de bien vouloir l'envoyer. Après cela, remplacez ce modèle par {{vector version available|nouveau nom d'image.svg}}.
|
Historique du fichier
Cliquer sur une date et heure pour voir le fichier tel qu'il était à ce moment-là.
| Date et heure | Vignette | Dimensions | Utilisateur | Commentaire | |
|---|---|---|---|---|---|
| actuel | 4 février 2007 à 19:27 | | 1 064 × 1 006 (55 kio) | Oleg Alexandrov | Made by myself with Matlab. {{PD}} |
| 4 février 2007 à 19:24 |  | 1 064 × 1 006 (55 kio) | Oleg Alexandrov | Made by myself with Matlab. {{PD}} |
Utilisation du fichier
La page suivante utilise ce fichier :
Usage global du fichier
Les autres wikis suivants utilisent ce fichier :
- Utilisation sur ar.wikipedia.org
- Utilisation sur ba.wikipedia.org
- Utilisation sur be-tarask.wikipedia.org
- Utilisation sur be.wikipedia.org
- Utilisation sur cv.wikipedia.org
- Utilisation sur de.wikipedia.org
- Utilisation sur en.wikipedia.org
- Utilisation sur hr.wikibooks.org
- Utilisation sur it.wikipedia.org
- Utilisation sur ja.wikipedia.org
- Utilisation sur kk.wikipedia.org
- Utilisation sur ko.wikipedia.org
- Utilisation sur nl.wikipedia.org
- Utilisation sur pl.wikipedia.org
- Utilisation sur ru.wikipedia.org
- Utilisation sur uk.wikipedia.org