Fichier:Associated Legendre Poly.svg

Taille de cet aperçu PNG pour ce fichier SVG : 540 × 360 pixels. Autres résolutions : 320 × 213 pixels | 640 × 427 pixels | 1 024 × 683 pixels | 1 280 × 853 pixels | 2 560 × 1 707 pixels.
Fichier d’origine (Fichier SVG, nominalement de 540 × 360 pixels, taille : 48 kio)
Ce fichier et sa description proviennent de Wikimedia Commons.
Description
| Description |
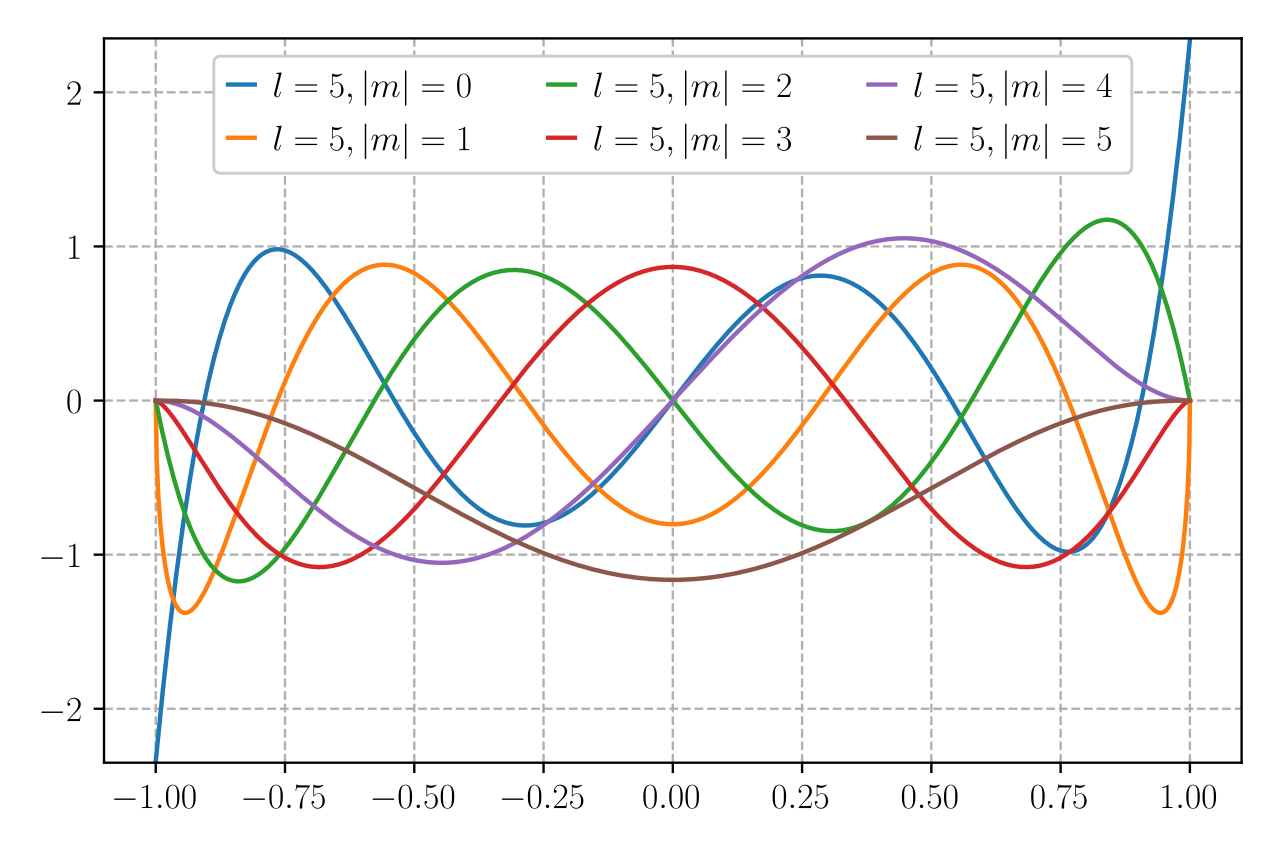
English: Curves of Associated Legendre function. The functions are normalized, i.e. what is plotted is |
||||
| Date | |||||
| Source | Travail personnel | ||||
| Auteur | Krishnavedala | ||||
| SVG information | Cette représentation graphique a été créée avec Matplotlib | ||||
| Code source | Python code
Data
|

Conditions d’utilisation
Moi, en tant que détenteur des droits d’auteur sur cette œuvre, je la publie sous les licences suivantes :
Ce fichier est disponible selon les termes de la licence Creative Commons Attribution – Partage dans les Mêmes Conditions 3.0 (non transposée).
- Vous êtes libre :
- de partager – de copier, distribuer et transmettre cette œuvre
- d’adapter – de modifier cette œuvre
- Sous les conditions suivantes :
- paternité – Vous devez donner les informations appropriées concernant l'auteur, fournir un lien vers la licence et indiquer si des modifications ont été faites. Vous pouvez faire cela par tout moyen raisonnable, mais en aucune façon suggérant que l’auteur vous soutient ou approuve l’utilisation que vous en faites.
- partage à l’identique – Si vous modifiez, transformez, ou vous basez sur cette œuvre, vous devez distribuer votre contribution sous la même licence ou une licence compatible avec celle de l’original.

|
Vous avez la permission de copier, distribuer et modifier ce document selon les termes de la GNU Free Documentation License version 1.2 ou toute version ultérieure publiée par la Free Software Foundation, sans sections inaltérables, sans texte de première page de couverture et sans texte de dernière page de couverture. Un exemplaire de la licence est inclus dans la section intitulée GNU Free Documentation License. |
Vous pouvez choisir l’une de ces licences.
Historique du fichier
Cliquer sur une date et heure pour voir le fichier tel qu'il était à ce moment-là.
| Date et heure | Vignette | Dimensions | Utilisateur | Commentaire | |
|---|---|---|---|---|---|
| actuel | 3 décembre 2020 à 22:38 | | 540 × 360 (48 kio) | AkanoToE | Adjusted normalization, legend formatting, and text formatting |
| 25 avril 2018 à 00:05 |  | 785 × 466 (69 kio) | Krishnavedala | Reverted to version as of 21:58, 24 April 2018 (UTC) - fonts not rendered properly on wiki | |
| 25 avril 2018 à 00:04 |  | 795 × 468 (47 kio) | Krishnavedala | removed embedded fonts - smaller file size | |
| 24 avril 2018 à 23:58 |  | 785 × 466 (69 kio) | Krishnavedala | recreated better clarity and smaller size | |
| 25 novembre 2010 à 16:31 |  | 900 × 675 (508 kio) | Krishnavedala | {{Information |Description={{en|1=Curves of Associated Legendre function generated in C program using the PLplot library.}} |Source={{own}} |Author=[[User:Krishnavedala| |
Utilisation du fichier
La page suivante utilise ce fichier :
Usage global du fichier
Les autres wikis suivants utilisent ce fichier :
- Utilisation sur en.wikipedia.org
- Utilisation sur hu.wikipedia.org
- Utilisation sur pt.wikipedia.org
- Utilisation sur zh.wikipedia.org