Fichier:Subprime Crisis Diagram - X1.png

Fichier d’origine (960 × 720 pixels, taille du fichier : 17 kio, type MIME : image/png)
Ce fichier et sa description proviennent de Wikimedia Commons.
Description
| Description |
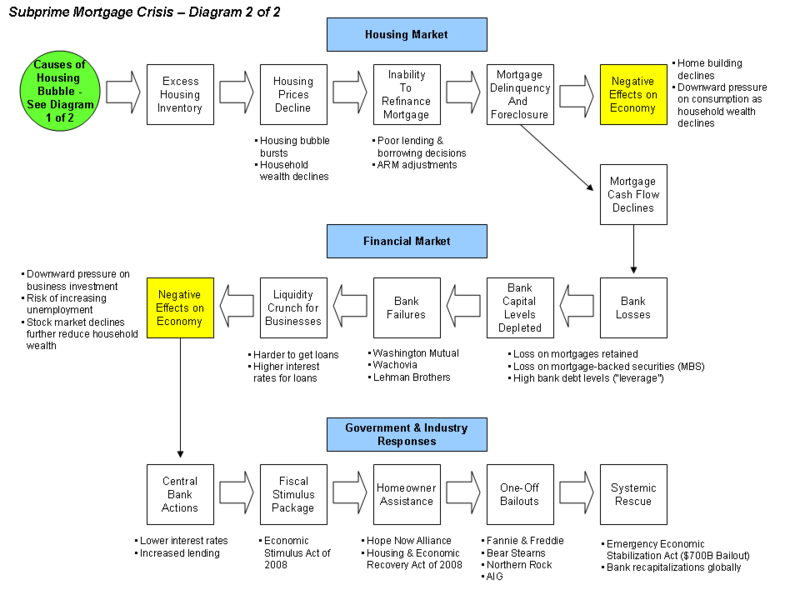
English: Diagram of the Subprime Mortgage Crisis SourcesThe many sources supporting this diagram are those used for the 2007 Subprime mortgage financial crisis and the linked articles below. Hopefully, this helps you visualize the elements. There is no substitute for reading the article first. This diagram is intended to illustrate how declines in the housing market transfer through the mortgage-backed securities to the financial markets, damaging the banks and economy along the way. Text Explanation of the DiagramThe ripple or domino effect was summarized in plain language by President Bush in his address to the Nation on September 24, 2008.[1]
Other Information
Caveats
SourcesThe letters from Fed Chairman Bernanke provide a helpful explanation of the subject.[6] [7] Further, several cover stories and in-depth articles appeared in the Economist[8] [9] [10] and Business Week.[11] Former Federal Reserve Chairman Greenspan wrote an Op Ed piece for the Wall Street Journal that summarizes the crisis from a variety of angles.[12] Economist Joseph Stiglitz summarized his views on the causes of the crisis.[13] Image of the Housing BubbleThis diagram can be better understood in the context of the housing bubble. The subprime mortgage crisis followed the bursting of the United states housing bubble. thumb|Building of the Housing Bubble ReferencesConditions d’utilisationThis is the original. Do not delete. |
| Date | |
| Source | Travail personnel (Texte original : I created this work entirely by myself.) |
| Auteur | Farcaster (talk) 05:18, 10 October 2008 (UTC) |
Conditions d’utilisation
- ↑ President's Address to the Nation
- ↑ The Wall Street Journal Online - Featured Article
- ↑ Krugman - NYT
- ↑ Krugman - NYT - Gordon does Good
- ↑ Time Magazine - Lessons from Japan & Asia
- ↑ FRB: Speech-Bernanke, Financial Markets, the Economic Outlook, and Monetary Policy -January 10, 2008
- ↑ FRB: Speech-Bernanke, The Recent Financial Turmoil and its Economic and Policy Consequences-October 15, 2007
- ↑ The credit crunch | Postcards from the ledge | Economist.com]
- ↑ CSI: credit crunch | Economist.com]
- ↑ America's economy | Getting worried downtown | Economist.com]
- ↑ Housing Meltdown
- ↑ The Wall Street Journal Online - Featured Article
- ↑ Stiglitz-Vanity Fair
- Vous êtes libre :
- de partager – de copier, distribuer et transmettre cette œuvre
- d’adapter – de modifier cette œuvre
- Sous les conditions suivantes :
- paternité – Vous devez donner les informations appropriées concernant l'auteur, fournir un lien vers la licence et indiquer si des modifications ont été faites. Vous pouvez faire cela par tout moyen raisonnable, mais en aucune façon suggérant que l’auteur vous soutient ou approuve l’utilisation que vous en faites.
- partage à l’identique – Si vous modifiez, transformez, ou vous basez sur cette œuvre, vous devez distribuer votre contribution sous la même licence ou une licence compatible avec celle de l’original.

|
Vous avez la permission de copier, distribuer et modifier ce document selon les termes de la GNU Free Documentation License version 1.2 ou toute version ultérieure publiée par la Free Software Foundation, sans sections inaltérables, sans texte de première page de couverture et sans texte de dernière page de couverture. Un exemplaire de la licence est inclus dans la section intitulée GNU Free Documentation License. |
Journal des téléversements d’origine
- 2008-10-21 02:40 Farcaster 960×720× (17754 bytes)
- 2008-10-10 06:59 Farcaster 960×720× (16556 bytes)
- 2008-10-10 05:44 Farcaster 960×720× (16328 bytes)
- 2008-10-10 05:30 Farcaster 960×720× (15892 bytes)
- 2008-10-10 05:18 Farcaster 960×720× (15896 bytes) {{Information |Description=Diagram of the Subprime Mortgage Crisis |Source=I created this work entirely by myself. |Date=October 10, 2008 |Author=~~~~ |other_versions= }}
Historique du fichier
Cliquer sur une date et heure pour voir le fichier tel qu'il était à ce moment-là.
| Date et heure | Vignette | Dimensions | Utilisateur | Commentaire | |
|---|---|---|---|---|---|
| actuel | 14 octobre 2010 à 02:47 | | 960 × 720 (17 kio) | Hideokun | {{Information |Description={{en|Diagram of the Subprime Mortgage Crisis<br/> ==Sources== The many sources supporting this diagram are those used for the en:2007 Subprime mortgage financial crisis and the linked articles below. Hopefully, this helps |
Utilisation du fichier
La page suivante utilise ce fichier :
Usage global du fichier
Les autres wikis suivants utilisent ce fichier :
- Utilisation sur hi.wikipedia.org
- Utilisation sur it.wikipedia.org
- Utilisation sur ja.wikipedia.org
- Utilisation sur kk.wikipedia.org
- Utilisation sur kn.wikipedia.org
- Utilisation sur ru.wikipedia.org
- Utilisation sur ta.wikipedia.org
- Utilisation sur www.wikidata.org