Fichier:Simpson's paradox continuous.svg

Taille de cet aperçu PNG pour ce fichier SVG : 390 × 260 pixels. Autres résolutions : 320 × 213 pixels | 640 × 427 pixels | 1 024 × 683 pixels | 1 280 × 853 pixels | 2 560 × 1 707 pixels.
Fichier d’origine (Fichier SVG, nominalement de 390 × 260 pixels, taille : 18 kio)
Ce fichier et sa description proviennent de Wikimedia Commons.
W3C-validity not checked.
Description
| Description |
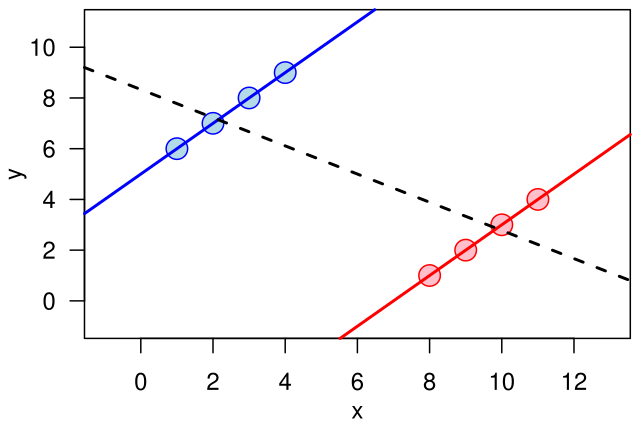
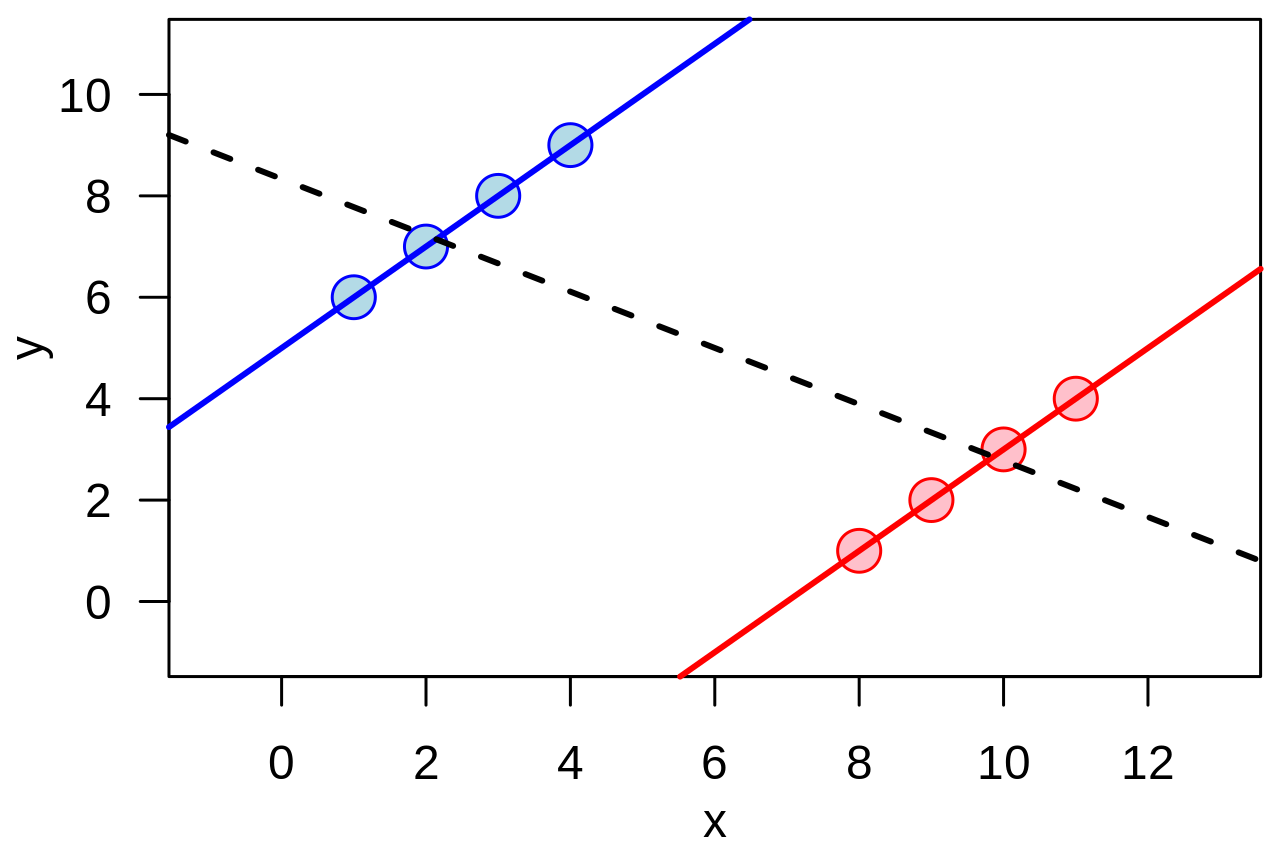
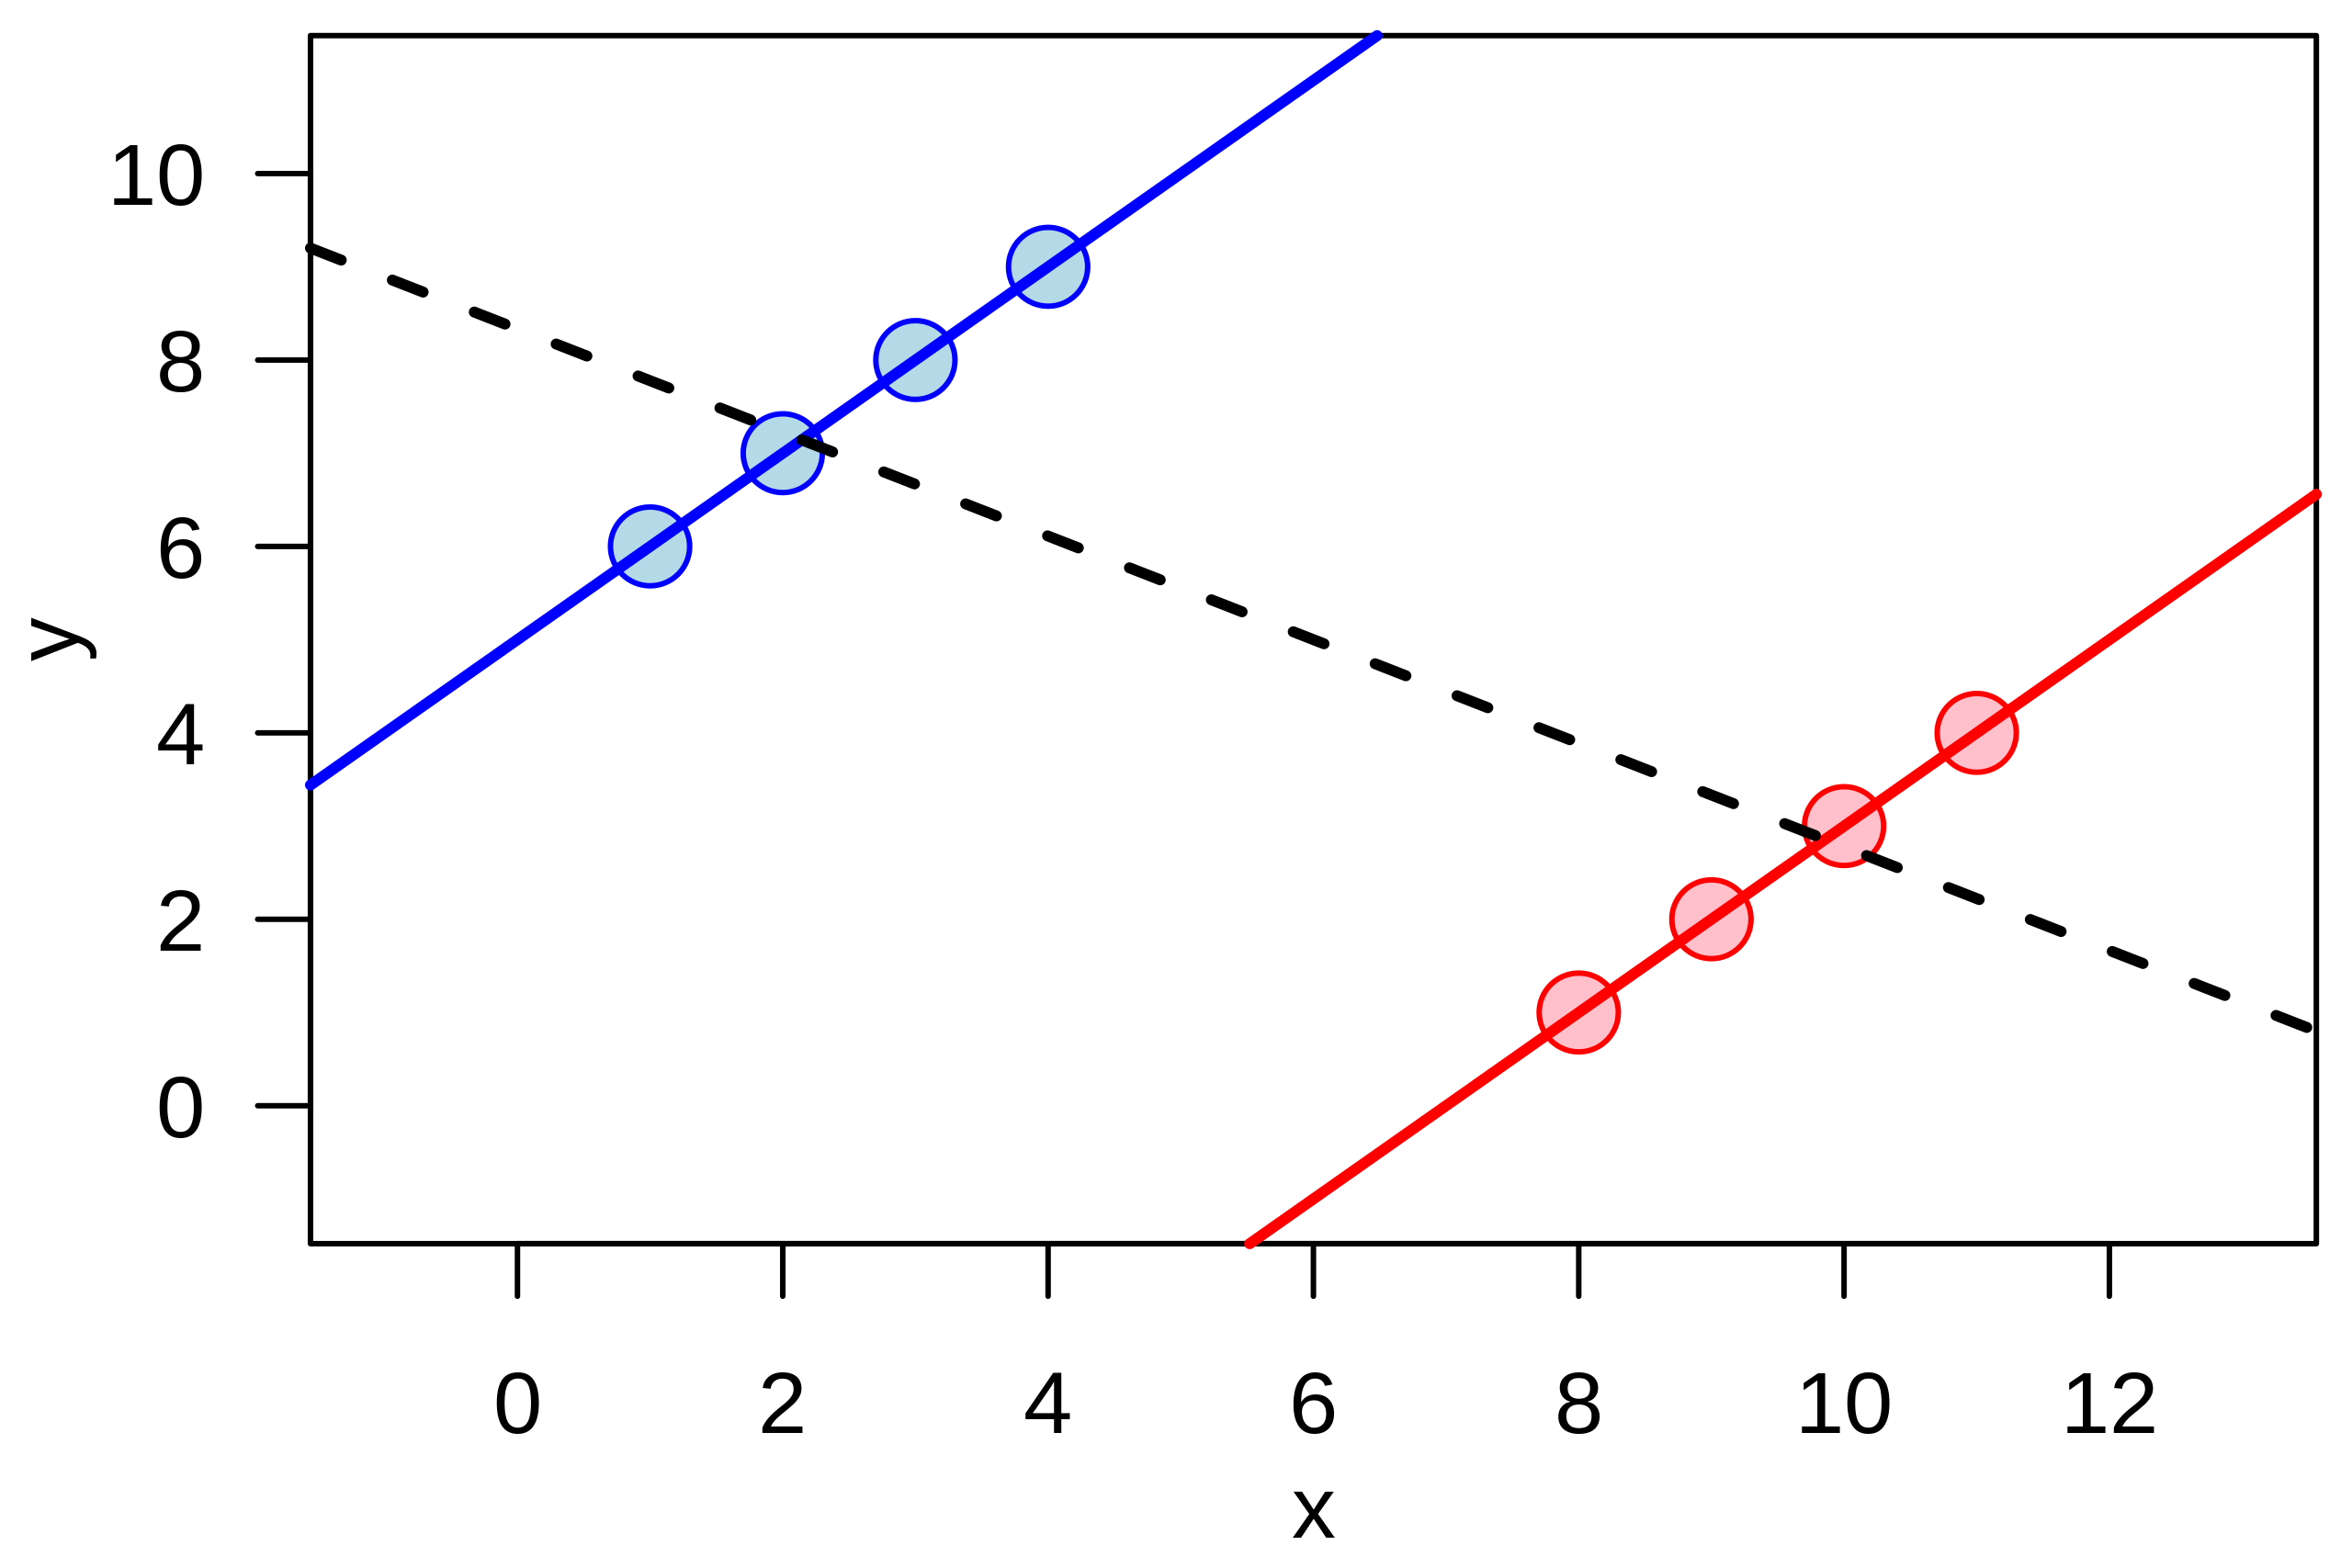
English: Illustration of the quantitative version of en:Simpson's paradox: a positive trend appears for two separate groups (blue and red), whereas a negative trend (black, dashed) appears when the groups are combined. |
| Date | |
| Source | Travail personnel |
| Auteur | Schutz |
Example of the quantitative version of w:Simpson's paradox.
The graphic was created by User:Schutz for Wikipedia on 14 June 2007, using the R statistical project. The program that generated and exported the graphic is given below; the uploaded version was generated slightly differently to workaround a bug during the PS to SVG conversion with pstoedit command. The layout was slightly modified using Inkscape before upload.
  x1 <- c(1,2,3,4)
  y1 <- x1 + 5

  x2 <- x1 + 7
  y2 <- x2 - 7

  x <- c(x1,x2)
  y <- c(y1,y2)

  postscript("simpson.eps", paper="special", width=4.5, height=3)

  par(las=1)
  par(mar=c(3,3,0.5,0.5))
  par(mgp=c(2,1,0))

  plot(x,y, cex=2, pch=21,
       col=rep(c("blue", "red"), each=4), bg=rep(c("lightblue", "pink"), each=4),
       xlim=range(x)+c(-2,2), ylim=range(y)+c(-2,2))
  abline(lm(y1 ~ x1), col="blue", lwd=2)
  abline(lm(y2 ~ x2), col="red", lwd=2)
  abline(lm(y  ~ x), lwd=2, lty=2)

  dev.off()
Conditions d’utilisation
| Cette œuvre a été placée dans le domaine public par son auteur, I, Schutz. Ceci s’applique dans le monde entier. Dans certains pays, ceci peut ne pas être possible ; dans ce cas : I, Schutz accorde à toute personne le droit d’utiliser cette œuvre dans n’importe quel but, sans aucune condition, sauf celles requises par la loi. |
Historique du fichier
Cliquer sur une date et heure pour voir le fichier tel qu'il était à ce moment-là.
| Date et heure | Vignette | Dimensions | Utilisateur | Commentaire | |
|---|---|---|---|---|---|
| actuel | 14 juin 2007 à 01:15 | | 390 × 260 (18 kio) | Schutz | {{Information |Description=Illustration of the continuous version of Simpson's paradox |Source=self-made |Date=14 June 2007 |Author=Schutz }} Example of the continuous version of w:Simpson's paradox. The graphic was created by [[User |
Utilisation du fichier
La page suivante utilise ce fichier :
Usage global du fichier
Les autres wikis suivants utilisent ce fichier :
- Utilisation sur ar.wikipedia.org
- Utilisation sur ca.wikipedia.org
- Utilisation sur cs.wikipedia.org
- Utilisation sur cy.wikipedia.org
- Utilisation sur de.wikipedia.org
- Utilisation sur en.wikipedia.org
- Utilisation sur es.wikipedia.org
- Utilisation sur eu.wikipedia.org
- Utilisation sur fi.wikipedia.org
- Utilisation sur he.wikipedia.org
- Utilisation sur ko.wikipedia.org
- Utilisation sur nl.wikipedia.org
- Utilisation sur no.wikipedia.org
- Utilisation sur pl.wikipedia.org
- Utilisation sur pt.wikipedia.org
- Utilisation sur ru.wikipedia.org
- Utilisation sur sk.wikipedia.org
- Utilisation sur ta.wikipedia.org
- Utilisation sur uk.wikipedia.org
- Utilisation sur vi.wikipedia.org
- Utilisation sur www.wikidata.org
- Utilisation sur zh.wikipedia.org