Fichier:Projected change in global sea level rise if atmospheric carbon dioxide concentrations were to either quadruple or double (NOAA GFDL).png
Projected_change_in_global_sea_level_rise_if_atmospheric_carbon_dioxide_concentrations_were_to_either_quadruple_or_double_(NOAA_GFDL).png (650 × 485 pixels, taille du fichier : 17 kio, type MIME : image/png)
Ce fichier et sa description proviennent de Wikimedia Commons.
.png?uselang=fr)
Description
| Description |
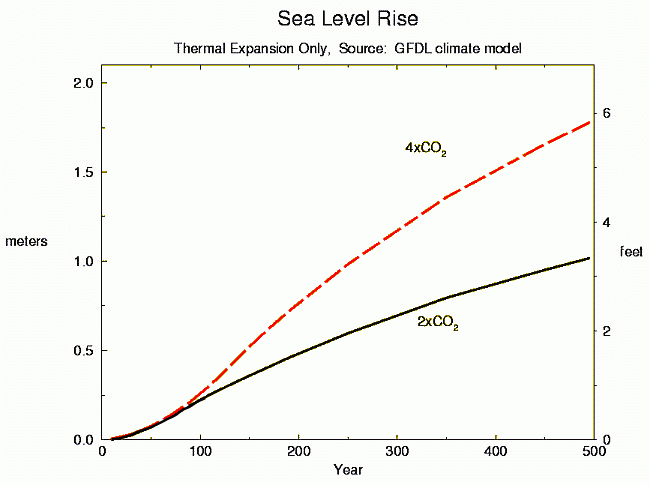
English: This graph shows the projected change in global sea level rise if atmospheric carbon dioxide (CO2) concentrations were to either quadruple or double. Edited quote from the cited public-domain source: In response to greenhouse gas warming, sea level is expected to rise due to the thermal expansion of sea water as the ocean warms. Because the deep ocean will warm much more slowly than the upper ocean, the thermally driven rise in sea level is expected to continue for centuries after atmospheric CO2 stops increasing. The graph shows the increase of global mean sea level in the GFDL 4xCO2 coupled climate model experiment. Even though CO2 no longer increases after year 140, sea level continues to rise steadily well beyond year 500. The final equilibrium sea level change in the model is 1.9 meters for a CO2 doubling (not shown) which is roughly the level attained in the CO2 quadrupling experiment after 500 years. The equilibrium rise for the quadrupling experiment has not yet been simulated.
These sea level rise projections are the expected changes due to thermal expansion of sea water alone, and do not include the effect of melted continental ice sheets. With the effect of ice sheets included, the total rise could be larger by a substantial factor. However, projections of the contribution of the ice sheets to future sea level rise are not presented here due to the difficulties of performing a credible calculation. For reference, the volume of ice in the Greenland and Antarctica ice sheets is equivalent to a sea level rise of 7 and 73 meters, respectively (IPCC, 1995) (see current sea level rise for more information). Details on the simulation The results presented are based on several multi-century integrations of a GFDL global coupled ocean-atmosphere model. The model resolution is about 4 degrees latitude. In the quadrupled (4xCO2) experiment, CO2 increases at 1% per year (compounded) to a level four times that of the present climate. After this 140 year "ramp-up" period, the model is integrated for several more centuries to examine the long time response of the climate system, including the deep ocean. For comparison, results are also presented from the 2xCO2 experiment, in which CO2 increases by a factor or two in the first 70 years, and then is constant at 2xCO2 for several more centuries of model integration. |
| Date | |
| Source | Geophysical Fluid Dynamics Laboratory - Climate Impact of Quadrupling CO2[1], Princeton, NJ, USA: NOAA GFDL, (Please provide a date or year) |
| Auteur | NOAA GFDL |
| Cette image a été retouchée, ce qui signifie qu'elle a été modifiée par ordinateur et est différente de l'image d'origine. Liste des modifications : (1) Changed color of graph's background from yellow to white, (2) changed solid red line plotted on graph to a dashed red line (ensures the graph can be used by color-blind users and printed using a grey-scale printer).
|
Conditions d’utilisation
| Cette œuvre est dérivée d'une œuvre placée initialement dans le domaine public. Elle a été modifiée et/ou améliorée par manipulation informatique. Cette œuvre a été subséquemment publiée (ou bien est par la présente placée) dans le domaine public par son auteur, Enescot. Ceci s'applique dans le monde entier. Dans certains pays, ceci peut ne pas être possible ; dans ce cas :
|
Historique du fichier
Cliquer sur une date et heure pour voir le fichier tel qu'il était à ce moment-là.
| Date et heure | Vignette | Dimensions | Utilisateur | Commentaire | |
|---|---|---|---|---|---|
| actuel | 18 décembre 2012 à 07:12 | | 650 × 485 (17 kio) | Enescot | {{Information |Description ={{en|1=This graph shows the projected change in global sea level rise if atmospheric carbon dioxide (CO<sub>2</sub>) concentrations were to either quadruple or dou... |
Utilisation du fichier
La page suivante utilise ce fichier :
Usage global du fichier
Les autres wikis suivants utilisent ce fichier :
- Utilisation sur cy.wikipedia.org
- Utilisation sur el.wikipedia.org
- Utilisation sur tr.wikipedia.org
- Utilisation sur uk.wikipedia.org
.png)