Fichier:Floyd flood map.jpg
Floyd_flood_map.jpg (350 × 269 pixels, taille du fichier : 35 kio, type MIME : image/jpeg)
Ce fichier et sa description proviennent de Wikimedia Commons.
Description
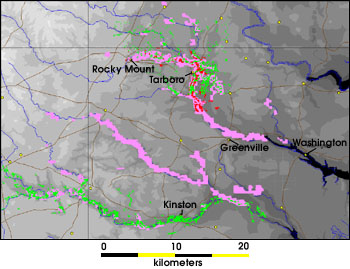
This flood map shows a comparison of the flood data collected by AVHRR (pink pixels), Radarsat (red pixels), and Landsat 7 (green pixels). These colors show areas that were flooded in the wake of Hurricane Floyd. Due to interference from clouds and forest canopies, geographers often get the best insight into a flood when they use data from multiple satellite sensors. (Image courtesy Dartmouth Flood Observatory, E. Anderson and R.H. Brakenridge)
| Color | Date | Source |
|---|---|---|
| September 17 | AVHRR | |
| September 23 | Radarsat | |
| September 30 | Landsat 7 |
Source
http://earthobservatory.nasa.gov/Study/FloydSediment/sediment_2.html - a larger image is available; the smaller image is preferred here because the text is larger
Conditions d’utilisation
| Ce fichier provient de la NASA. Sauf exception, les documents créés par la NASA ne sont pas soumis à copyright. Pour plus d'informations, voir la politique de copyright de la NASA. | ||
 |
Attention :
|
Historique du fichier
Cliquer sur une date et heure pour voir le fichier tel qu'il était à ce moment-là.
| Date et heure | Vignette | Dimensions | Utilisateur | Commentaire | |
|---|---|---|---|---|---|
| actuel | 31 janvier 2006 à 10:01 | | 350 × 269 (35 kio) | Jdorje~commonswiki | his flood map shows a comparison of the flood data collected by AVHRR (pink pixels), Radarsat (red pixels), and Landsat 7 (green pixels). These colors show areas that were flooded in the wake of Hurricane Floyd. Due to interference from clouds and forest |
Utilisation du fichier
La page suivante utilise ce fichier :
Usage global du fichier
Les autres wikis suivants utilisent ce fichier :
- Utilisation sur en.wikipedia.org
- Utilisation sur it.wikipedia.org