Fichier d’origine(2 406 × 1 978 pixels, taille du fichier : 55 kio, type MIME : image/png)

Ce fichier et sa description proviennent de Wikimedia Commons.

Description

Une version vectorielle de cette image existe, dans le format « SVG ». Si elle n’est pas inférieure, elle devrait être utilisée à la place de la présente version pour des affichages en plus grandes dimensions ou nécessitant une meilleure résolution.

File:Newton iteration.png → File:Newton iteration.svg

Pour plus d’informations sur les images vectorielles, consultez la page de transition de Commons vers le format SVG.
Voir aussi les informations à propos de la manière dont le logiciel MediaWiki gère les images au format SVG.
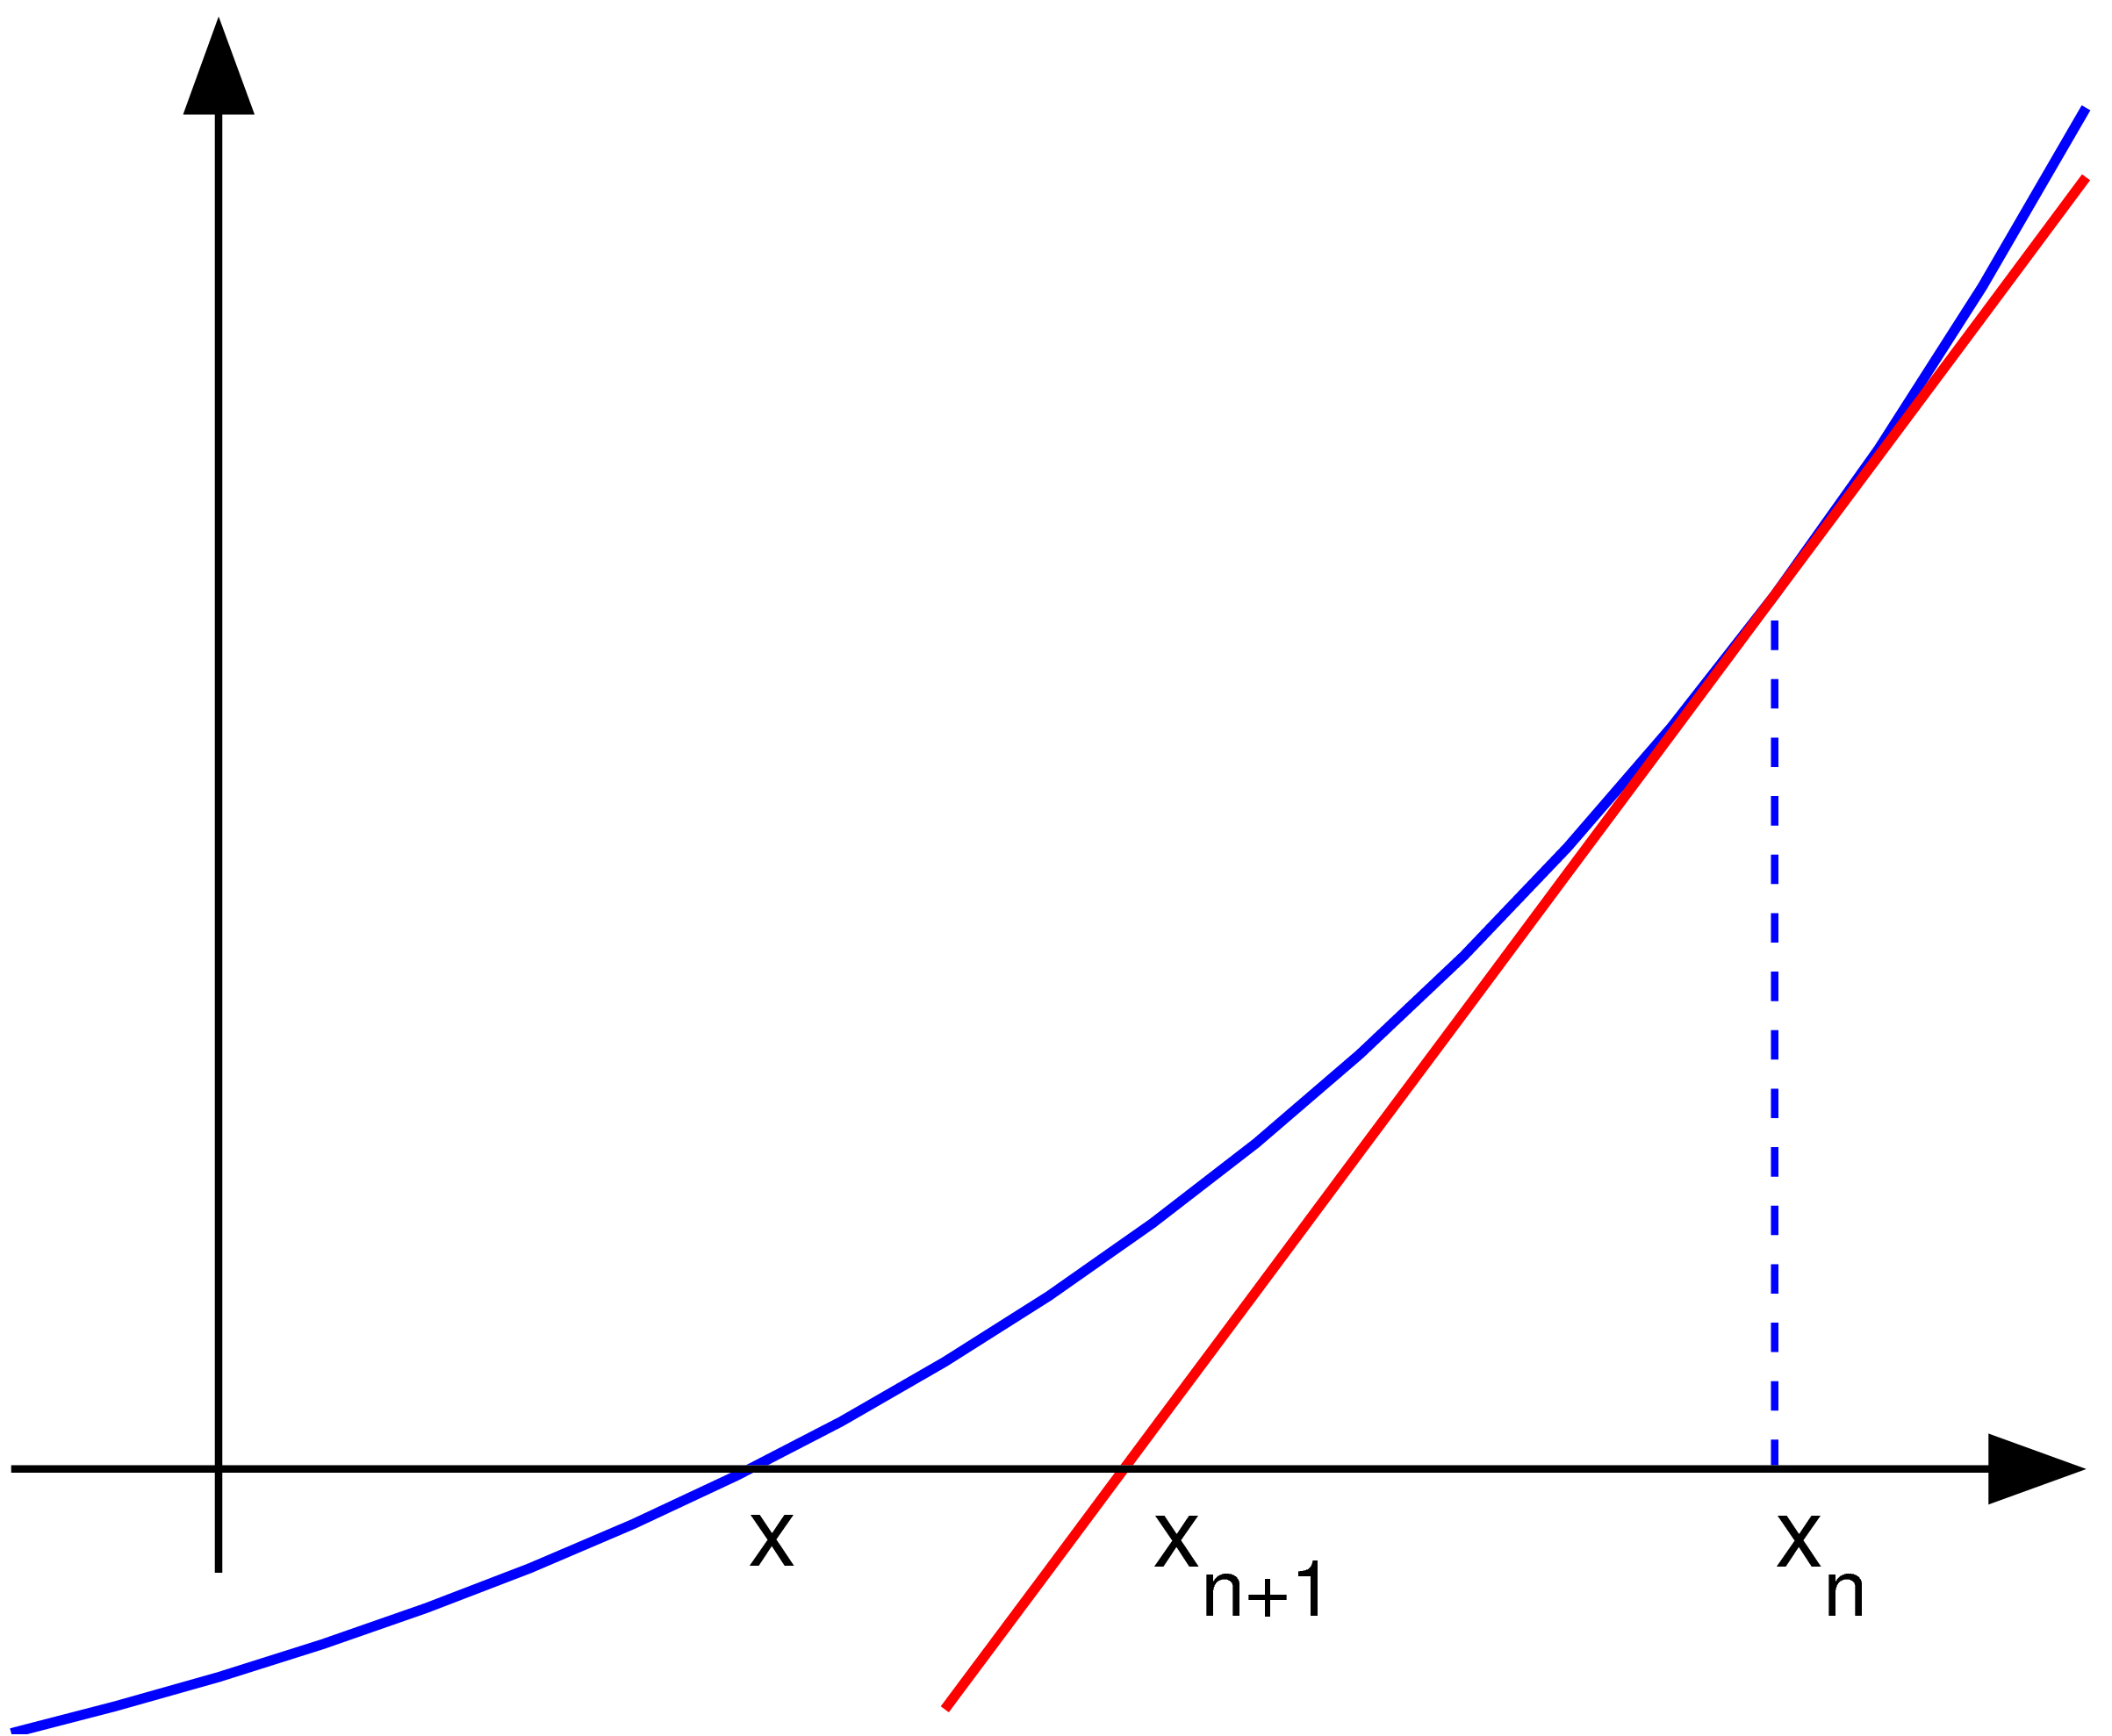
Dans les autres langues
Alemannisch  Bahasa Indonesia  Bahasa Melayu  British English  català  čeština  dansk  Deutsch  eesti  English  español  Esperanto  euskara  français  Frysk  galego  hrvatski  Ido  italiano  lietuvių  magyar  Nederlands  norsk bokmål  norsk nynorsk  occitan  Plattdüütsch  polski  português  português do Brasil  română  Scots  sicilianu  slovenčina  slovenščina  suomi  svenska  Tiếng Việt  Türkçe  vèneto  Ελληνικά  беларуская (тарашкевіца)  български  македонски  нохчийн  русский  српски / srpski  татарча/tatarça  українська  ქართული  հայերեն  বাংলা  தமிழ்  മലയാളം  ไทย  한국어  日本語  简体中文  繁體中文  עברית  العربية  فارسی  +/−
Nouvelle image SVG

Description Uploader graphed this with en:MATLAB (Illustration of en:Newton's method)
Date 22 novembre 2004 (first version); 2004-11-23 (last version)
Source Transféré de en.wikipedia à Commons.
Auteur Olegalexandrov sur Wikipédia anglais
PNG information
InfoField
 
Ce diagramme a été créé avec MATLAB
Code source
InfoField

MATLAB code

(Newton iteration)
% illustration of Newton's method for finding a zero of a function

function main ()
   
a=-1; b=1;   % interval endpoints
fs=20;       % text font size

% arrows settings
thickness1=2; thickness2=1.5; arrowsize=0.1; arrow_type=1;
angle=20; % in degrees

h=0.1;  % grid size
X=a:h:b; % points on the x axis
f=inline('exp(x)/1.5-0.5');   % function to plot
g=inline('exp(x)/1.5');       % derivative of f
x0=0.7; y0=f(x0);             % point at which to draw the tangent line 
m=g(x0);
Y=f(X);                       % points on the function to plot
XT=-0.1:h:b; YT=y0+(XT-x0)*m; % tangent line

% prepare the screen
clf; hold on; axis equal; axis off

% plot the graph and the tangent lines
plot(X, Y, 'linewidth', thickness1)
plot(XT, YT, 'r', 'linewidth', thickness1)
plot([x0 x0], [0, y0], '--', 'linewidth', thickness2)

% axes
small=0.2;
arrow([a 0], [b, 0], thickness2, arrowsize, angle, arrow_type, [0, 0, 0])
arrow([a+small, -0.1], [a+small, 1.4], thickness2, arrowsize, angle, arrow_type, [0, 0, 0])

% text
H=text(-0.29, -0.06,  'x'); set(H, 'fontsize', fs)
H=text(0.1, -0.1,  'x_{n+1}'); set(H, 'fontsize', fs)
H=text(0.7, -0.1,  'x_{n}'); set(H, 'fontsize', fs)

% save to disk
saveas(gcf, 'newton_iteration.eps', 'psc2')

function arrow(start, stop, thickness, arrow_size, sharpness, arrow_type, color)

% Function arguments:
% start, stop:  start and end coordinates of arrow, vectors of size 2
% thickness:    thickness of arrow stick
% arrow_size:   the size of the two sides of the angle in this picture ->
% sharpness:    angle between the arrow stick and arrow side, in degrees
% arrow_type:   1 for filled arrow, otherwise the arrow will be just two segments
% color:        arrow color, a vector of length three with values in [0, 1]

% convert to complex numbers
   i=sqrt(-1);
   start=start(1)+i*start(2); stop=stop(1)+i*stop(2);
   rotate_angle=exp(i*pi*sharpness/180);

% points making up the arrow tip (besides the "stop" point)
   point1 = stop - (arrow_size*rotate_angle)*(stop-start)/abs(stop-start);
   point2 = stop - (arrow_size/rotate_angle)*(stop-start)/abs(stop-start);

   if arrow_type==1 % filled arrow

      % plot the stick, but not till the end, looks bad
      t=0.5*arrow_size*cos(pi*sharpness/180)/abs(stop-start); stop1=t*start+(1-t)*stop;
      plot(real([start, stop1]), imag([start, stop1]), 'LineWidth', thickness, 'Color', color);

      % fill the arrow
      H=fill(real([stop, point1, point2]), imag([stop, point1, point2]), color);
      set(H, 'EdgeColor', 'none')

   else % two-segment arrow
      plot(real([start, stop]), imag([start, stop]),   'LineWidth', thickness, 'Color', color);
      plot(real([stop, point1]), imag([stop, point1]), 'LineWidth', thickness, 'Color', color);
      plot(real([stop, point2]), imag([stop, point2]), 'LineWidth', thickness, 'Color', color);
   end

Conditions d’utilisation

Public domain Cette œuvre a été placée dans le domaine public par son auteur, Olegalexandrov sur Wikipédia anglais. Ceci s’applique dans le monde entier.
Dans certains pays, ceci peut ne pas être possible ; dans ce cas :
Olegalexandrov accorde à toute personne le droit d’utiliser cette œuvre dans n’importe quel but, sans aucune condition, sauf celles requises par la loi.


Journal des téléversements d’origine

La page de description originale était ici. Tous les noms d'utilisateur qui suivent se rapportent à en.wikipedia.
  • 2004-11-23 19:55 Olegalexandrov 405×340×8 (14290 bytes) Scaled down the picture of Newton's method
  • 2004-11-22 21:34 Olegalexandrov 509×406×8 (16510 bytes) I graphed this with Matlab (Illustration of Newton's method) {{PD}}

Légendes

Ajoutez en une ligne la description de ce que représente ce fichier

Éléments décrits dans ce fichier

dépeint

Historique du fichier

Cliquer sur une date et heure pour voir le fichier tel qu'il était à ce moment-là.

Date et heureVignetteDimensionsUtilisateurCommentaire
actuel25 mai 2007 à 05:23Vignette pour la version du 25 mai 2007 à 05:232 406 × 1 978 (55 kio)Oleg Alexandrov{{Information |Description=Uploader graphed this with en:MATLAB (Illustration of en:Newton's method) ==Source code== <pre> <nowiki> % illustration of Newton's method for finding a zero of a function function main () a=-1; b=1; % interva
13 juin 2005 à 01:11Vignette pour la version du 13 juin 2005 à 01:11405 × 340 (6 kio)Everlongoptimized for smaller file size
18 janvier 2005 à 01:06Vignette pour la version du 18 janvier 2005 à 01:06405 × 340 (14 kio)Andreas Ipp~commonswiki{{PD}}: Original author graphed this with MATLAB (Illustration of Newton's method), from Wikipedia.

La page suivante utilise ce fichier :

Usage global du fichier

Les autres wikis suivants utilisent ce fichier :