Fichier:Mpl screenshot figures and code.png

Taille de cet aperçu : 752 × 599 pixels. Autres résolutions : 301 × 240 pixels | 602 × 480 pixels | 964 × 768 pixels | 1 227 × 978 pixels.
Fichier d’origine (1 227 × 978 pixels, taille du fichier : 350 kio, type MIME : image/png)
Ce fichier et sa description proviennent de Wikimedia Commons.
Description
| Description |
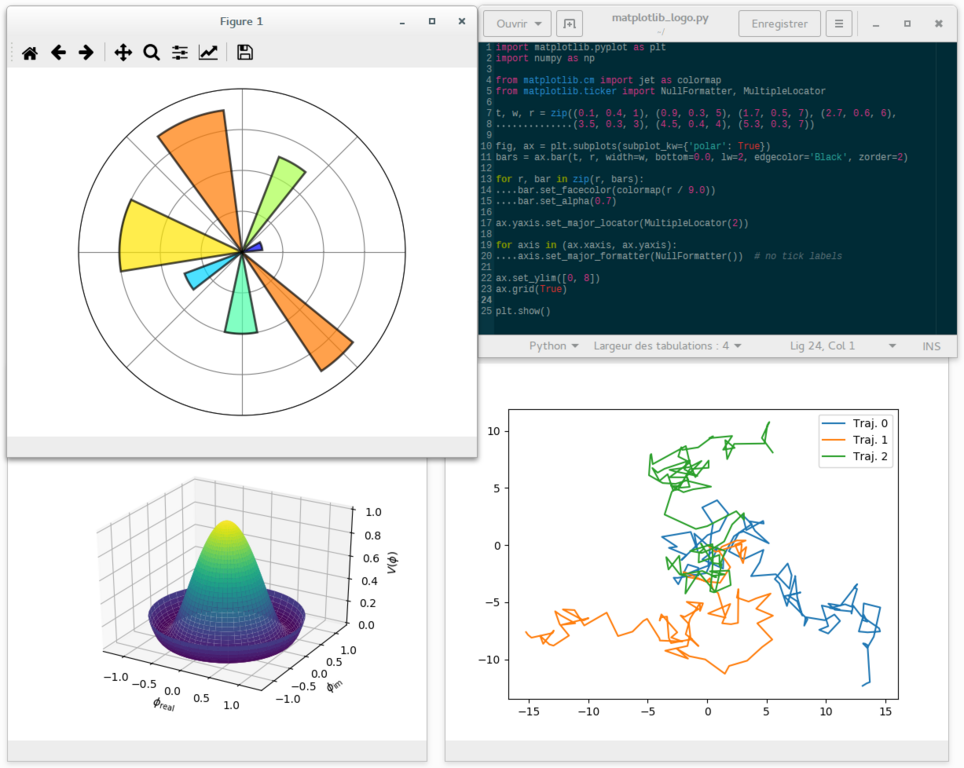
English: A screenshot showing matplotlib plots of a polar bar graph resembling the matplotlib logo (upper left), a 3D surface graph with the new default 'viridis' colormap (lower left), a graph of 2D random walk trajectories (lower right), and the python source code (of the logo part) opened in a text editor (upper right). |
| Date | |
| Source | Travail personnel |
| Auteur | Adrien F. Vincent |
Rationale: this work aims at providing an up-to-date version of the previous work https://en.wikipedia.org/wiki/File:Matplotlib_screenshot.png , done by Geek3.
The matplotlib (mpl) version is the development branch 2.x, with Python 2.7.11 and numpy 1.11.1
##########
## Code for the mpl logo figure
##########
import matplotlib.pyplot as plt
import numpy as np

from matplotlib.cm import jet as colormap
from matplotlib.ticker import NullFormatter, MultipleLocator

t, w, r = zip((0.1, 0.4, 1), (0.9, 0.3, 5), (1.7, 0.5, 7), (2.7, 0.6, 6),
              (3.5, 0.3, 3), (4.5, 0.4, 4), (5.3, 0.3, 7))

fig, ax = plt.subplots(subplot_kw={'polar': True})
bars = ax.bar(t, r, width=w, bottom=0.0, lw=2, edgecolor='Black', zorder=2)

for r, bar in zip(r, bars):
    bar.set_facecolor(colormap(r / 9.0))
    bar.set_alpha(0.7)

ax.yaxis.set_major_locator(MultipleLocator(2))

for axis in (ax.xaxis, ax.yaxis):
    axis.set_major_formatter(NullFormatter())  # no tick labels

ax.set_ylim([0, 8])
ax.grid(True)

plt.show()
####################
##########
## Code for the 3D surface plot and the 2D random walk tajectories
##########
import matplotlib.pyplot as plt
import numpy as np

from mpl_toolkits.mplot3d import Axes3D
from matplotlib.cm import viridis as colormap

"""
Figure 1: a 3D surface plot (from matplotlib gallery)
"""
step = 0.04
maxval = 1.0
fig1 = plt.figure("Figure_1")
ax1 = fig1.add_subplot(111, projection='3d')

# Create supporting points in polar coordinates
r = np.linspace(0, 1.2, 50)
p = np.linspace(0, 2*np.pi, 50)
R, P = np.meshgrid(r, p)
# Transform them to cartesian system
X, Y = R*np.cos(P), R*np.sin(P)

Z = ((R**2 - 1)**2)
ax1.plot_surface(X, Y, Z, rstride=1, cstride=1, cmap=colormap)
ax1.set_zlim3d(0, 1)
ax1.set_xlabel(r'$\phi_\mathrm{real}$')
ax1.set_ylabel(r'$\phi_\mathrm{im}$')
ax1.set_zlabel(r'$V(\phi)$')

"""
Figure 2: a few examples of 2D random walk
"""
fig2, ax2 = plt.subplots(num="Figure_2")

prng = np.random.RandomState(123)

x = np.linspace(0, 10, 101)

def random_walk(xy0=(0.0, 0.0), nsteps=100, std=1.0):
    xy = np.zeros((nsteps + 1, 2))
    xy[0,:] = xy0
    deltas = prng.normal(loc=0.0, scale=std, size=(nsteps, 2))
    xy[1:, :] = xy[0, :] + np.cumsum(deltas, axis=0)
    return xy

for cnt in range(3):
    traj = random_walk()
    ax2.plot(traj[:, 0], traj[:, 1], label="Traj. {c}".format(c=cnt))

ax2.legend(loc='best')

plt.show()
####################
Conditions d’utilisation
Moi, en tant que détenteur des droits d’auteur sur cette œuvre, je la publie sous la licence suivante :
Ce fichier est sous la licence Creative Commons Attribution – Partage dans les Mêmes Conditions 4.0 International.
- Vous êtes libre :
- de partager – de copier, distribuer et transmettre cette œuvre
- d’adapter – de modifier cette œuvre
- Sous les conditions suivantes :
- paternité – Vous devez donner les informations appropriées concernant l'auteur, fournir un lien vers la licence et indiquer si des modifications ont été faites. Vous pouvez faire cela par tout moyen raisonnable, mais en aucune façon suggérant que l’auteur vous soutient ou approuve l’utilisation que vous en faites.
- partage à l’identique – Si vous modifiez, transformez, ou vous basez sur cette œuvre, vous devez distribuer votre contribution sous la même licence ou une licence compatible avec celle de l’original.
Historique du fichier
Cliquer sur une date et heure pour voir le fichier tel qu'il était à ce moment-là.
| Date et heure | Vignette | Dimensions | Utilisateur | Commentaire | |
|---|---|---|---|---|---|
| actuel | 27 septembre 2016 à 11:52 | | 1 227 × 978 (350 kio) | Adrien F. Vincent | User created page with UploadWizard |
Utilisation du fichier
La page suivante utilise ce fichier :
Usage global du fichier
Les autres wikis suivants utilisent ce fichier :
- Utilisation sur bn.wikipedia.org
- Utilisation sur en.wikipedia.org
- Utilisation sur hu.wikipedia.org
- Utilisation sur ja.wikipedia.org
- Utilisation sur ko.wikipedia.org
- Utilisation sur pl.wikipedia.org
- Utilisation sur pt.wikipedia.org
- Utilisation sur sr.wikipedia.org
- Utilisation sur tr.wikipedia.org
- Utilisation sur zh.wikipedia.org