Fichier:Halflife-sim.gif
Pas de plus haute résolution disponible.
Halflife-sim.gif (100 × 188 pixels, taille du fichier : 17 kio, type MIME : image/gif, en boucle, 80 trames, 8,5 s)
Ce fichier et sa description proviennent de Wikimedia Commons.
Description
| Description |
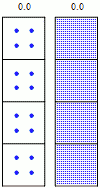
English: Simulation of many identical atoms undergoing radioactive decay, starting with either four atoms (left) or 400 atoms (right). The number at the top indicates how many half-lives have elapsed. Note the law of large numbers: With more atoms, the overall decay is less random. Image made with Mathematica, I am happy to send the source code if you would like to make this image more beautiful, or for any other reason. |
| Date | |
| Source | Travail personnel |
| Auteur | Sbyrnes321 |
Conditions d’utilisation
| Moi, propriétaire des droits d’auteur sur cette œuvre, la place dans le domaine public. Ceci s'applique dans le monde entier. Dans certains pays, ceci peut ne pas être possible ; dans ce cas : J’accorde à toute personne le droit d’utiliser cette œuvre dans n’importe quel but, sans aucune condition, sauf celles requises par la loi. |
(* Source code written in Mathematica 6.0, by Steve Byrnes, 2010. I release this code into the public domain. *)

SeedRandom[2]

(*Build list of point coordinates and radii*)

BuildCoordList[SqCenterX_, SqCenterY_, SqSide_, PtsPerRow_] :=
  Flatten[Table[{i, j}, {i, SqCenterX - SqSide/2, SqCenterX + SqSide/2, SqSide/(PtsPerRow - 1)},
     {j, SqCenterY - SqSide/2, SqCenterY + SqSide/2, SqSide/(PtsPerRow - 1)}], 1];

coordslist = Join[
   BuildCoordList[3.5, 1, 1.8, 20],
   BuildCoordList[3.5, 3, 1.8, 20],
   BuildCoordList[3.5, 5, 1.8, 20],
   BuildCoordList[3.5, 7, 1.8, 20],
   BuildCoordList[1, 1, .7, 2],
   BuildCoordList[1, 3, .7, 2],
   BuildCoordList[1, 5, .7, 2],
   BuildCoordList[1, 7, .7, 2]];
NumPts = Length[coordslist];
radiuslist = Join[Table[.03, {i, 1, 4*400}], Table[.1, {i, 1, 4*4}]];

(*Draw borders*)

xlist = {0, 2};
leftx = 0;
rightx = 2;
numx = Length[xlist];
ylist = {0, 2, 4, 6, 8};
topy = 0;
boty = 8;
numy = Length[ylist];
lines = {};
For[i = 1, i <= numy, i++,
  lines = Append[lines, Line[{{leftx, ylist[[i]]}, {rightx, ylist[[i]]}}]]];
For[i = 1, i <= numx, i++,
  lines = Append[lines, Line[{{xlist[[i]], topy}, {xlist[[i]], boty}}]]];

xlist = {2.5, 4.5};
leftx = 2.5;
rightx = 4.5;
numx = Length[xlist];
ylist = {0, 2, 4, 6, 8};
topy = 0;
boty = 8;
numy = Length[ylist];
For[i = 1, i <= numy, i++,
  lines = Append[lines, Line[{{leftx, ylist[[i]]}, {rightx, ylist[[i]]}}]]];
For[i = 1, i <= numx, i++,
  lines = Append[lines, Line[{{xlist[[i]], topy}, {xlist[[i]], boty}}]]];

(*Write numbers:
I want to be able to write a number with one decimal place,
including padding with ".0" when it's an integer.*)

WriteNum[num_] := Block[{rounded}, rounded = N[Floor[num, 0.1]];
    If[FractionalPart[rounded] == 0, ToString[rounded] <> "0", ToString[rounded]]];

(*Randomly choose decay times:
To get an expontial-decay-distributed random number, we pick a number uniformly between 0 and 1.
Take its negative log to get the time that it blows up, which is between 0 and infinity.
But divide by log 2 so that when the time = 1, there's 50% chance of decaying. *)

BlowTime = Table[-Log[RandomReal[]]/Log[2], {i, 1, NumPts}];

(*Draw graphics*)

GraphicsList = {};
NumFrames = 80;
TimePerFrame = .05;

Video = {};
For[frame = 1, frame <= NumFrames, frame++,
  CurrentTime = (frame - 1)*TimePerFrame;
  ImageGraphicsList = lines;
  ImageGraphicsList =
   Append[ImageGraphicsList, Text[WriteNum[CurrentTime], {.8, 8.5}, {-1, 0}]];
  ImageGraphicsList =
   Append[ImageGraphicsList, Text[WriteNum[CurrentTime], {3.3, 8.5}, {-1, 0}]];
  For[pt = 1, pt <= NumPts, pt++,
   If[CurrentTime < BlowTime[[pt]],
    ImageGraphicsList =   Append[ImageGraphicsList, {Blue, Disk[coordslist[[pt]], radiuslist[[pt]]]}]]];
  Video = Append[Video, Graphics[ImageGraphicsList, ImageSize -> 100]];];

(*Pause at start*)
Video = Join[Table[Video[[1]], {i, 1, 5}], Video];

(*Export*)
Export["test.gif", Video, "DisplayDurations" -> {10}, "AnimationRepititions" -> Infinity ]
Historique du fichier
Cliquer sur une date et heure pour voir le fichier tel qu'il était à ce moment-là.
| Date et heure | Vignette | Dimensions | Utilisateur | Commentaire | |
|---|---|---|---|---|---|
| actuel | 25 mars 2010 à 21:41 | | 100 × 188 (17 kio) | Aiyizo | Optimized animation, converted to 16 color mode |
| 5 février 2010 à 08:35 |  | 100 × 188 (156 kio) | Sbyrnes321 | Changed top-bottom split to left-right split, with space between; pause at start; 400 atoms in each crowded box instead of 296. (Thanks to Bdb484 for suggestions.) | |
| 29 janvier 2010 à 02:26 |  | 61 × 131 (75 kio) | Sbyrnes321 | {{Information |Description={{en|1=Simulation of many identical atoms undergoing radioactive decay. The number at the top indicates how many half-lives have elapsed. Note that after one half-life there are not ''exactly'' one-half of the atoms remaining, o |
Utilisation du fichier
La page suivante utilise ce fichier :
Usage global du fichier
Les autres wikis suivants utilisent ce fichier :
- Utilisation sur ast.wikipedia.org
- Utilisation sur ba.wikipedia.org
- Utilisation sur bg.wikipedia.org
- Utilisation sur bn.wikipedia.org
- Utilisation sur cs.wikipedia.org
- Utilisation sur cv.wikipedia.org
- Utilisation sur cy.wikipedia.org
- Utilisation sur da.wikipedia.org
- Utilisation sur de.wikibooks.org
- Utilisation sur en.wikipedia.org
- Utilisation sur en.wikibooks.org
- Utilisation sur et.wikipedia.org
- Utilisation sur fi.wikipedia.org
- Utilisation sur ga.wikipedia.org
- Utilisation sur he.wikipedia.org
- Utilisation sur hr.wikipedia.org
- Utilisation sur ja.wikipedia.org
- Utilisation sur ko.wikipedia.org
- Utilisation sur lv.wikipedia.org
- Utilisation sur mn.wikipedia.org
- Utilisation sur pt.wikipedia.org
- Utilisation sur ru.wikipedia.org
- Utilisation sur simple.wikipedia.org
- Utilisation sur tt.wikipedia.org
- Utilisation sur vi.wikipedia.org
- Utilisation sur www.wikidata.org