Fichier:Estimations of Human Brain Emulation Required Performance.svg

Taille de cet aperçu PNG pour ce fichier SVG : 800 × 600 pixels. Autres résolutions : 320 × 240 pixels | 640 × 480 pixels | 1 024 × 768 pixels | 1 280 × 960 pixels | 2 560 × 1 920 pixels.
Fichier d’origine (Fichier SVG, nominalement de 800 × 600 pixels, taille : 49 kio)
Ce fichier et sa description proviennent de Wikimedia Commons.
Description
| Description |
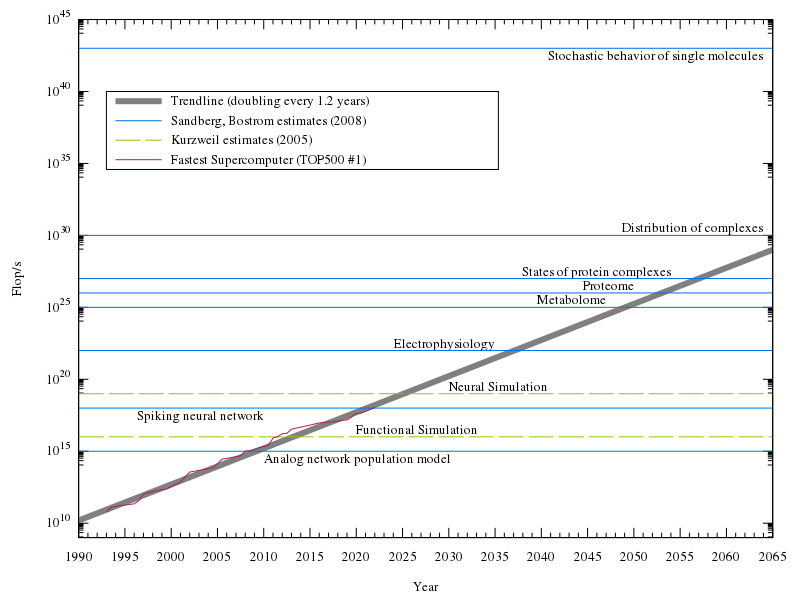
English: Estimates of how much processing power is needed to emulate a human brain at various levels, along with the fastest supercomputer from TOP500 mapped by year, and a trendline. Exponential plot, with assumption of doubling of computational power every 1.1 years for the trendline. |
| Date | |
| Source | Travail personnel, data from [1], PPTSuperComputersPRINT.jpg, and [2]. |
| Auteur | Tga.D |
| SVG information | |
| Code source | Gnuplot codeset terminal svg size 800 600 fname "Times,13"
set output "Estimations of Human Brain Emulation Required Performance.svg"
set notitle
set key reverse Left left at 1993, 10**40 noautotitles box # good chunk of whitespace to put the key in
set datafile separator ","
set logscale y # use a logarithmic scale, for easier visualization of exponential growth
set format y "10^{%T}"
set yrange[10**9:10**45]
set ylabel "Flop/s"
set xrange [1990:2065]
set xlabel "Year"
set xtics 1990,5,2065
set mxtics 5
#set grid # I think it looks better without, but it's a matter of preference
# labels for each of the levels of emulation
set label "Analog network population model" at 2010, 10**14.5 left
set label "Spiking neural network" at 2010, 10**17.5 right
set label "Electrophysiology" at 2035, 10**22.5 right
set label "Metabolome" at 2047, 10**25.5 right
set label "Proteome" at 2050, 10**26.5 right
set label "States of protein complexes" at 2054, 10**27.5 right
set label "Distribution of complexes" at 2064, 10**30.5 right
set label "Stochastic behavior of single molecules" at 2064, 10**42.5 right
set label "Functional Simulation" at 2020, 10**16.5 left
set label "Neural Simulation" at 2030, 10**19.5 left
# best-fit is as of June 2022 list, to two sigfigs
# horizontal lines plotted to represent levels of emulation
# plot of historical TOP500 #1's stored in a .csv
# colors and sizes picked from what I thought was easiest to see
# titles done for one of each type of line, for the key
plot 87000000000.0*(2**((x-1993)/1.2)) lw 6 lc 0 w lines title "Trendline (doubling every 1.2 years)",\
10**15 ls 3 lt rgb "#0073E6", \
10**18 ls 3 lt rgb "#0073E6", \
10**22 ls 3 lt rgb "#0073E6", \
10**25 ls 3 lt rgb "#0073E6", \
10**26 ls 3 lt rgb "#0073E6", \
10**27 ls 3 lt rgb "#0073E6", \
10**30 ls 3 lt rgb "#0073E6", \
10**43 ls 3 lt rgb "#0073E6" title "Sandberg, Bostrom estimates (2008)",\
10**16 ls 2 dt (50,10) lc rgb "#89CE00", \
10**19 ls 2 dt (50,10) lt rgb "#89CE00" title "Kurzweil estimates (2005)",\
"TOP500.csv" using 1:2 ls 1 lt rgb "#B51963" pt 7 ps .5 with linespoints title "Fastest Supercomputer (TOP500 #1)"
DataThe #1 computer over the years from TOP500, used to generate the supercomputer line at the end of the Gnuplot code. The name of each supercomputer is in the file, but unused in the code/chart. Whole number years represent a June list, .5 represents a November list.
Year,Flop/s,Name
1993,59700000000,CM-5/1024
1993.5,124000000000,Numerical Wind Tunnel
1994,143400000000,XP/S140
1994.5,170000000000,Numerical Wind Tunnel
1996,220400000000,SR2201/1024
1996.5,368200000000,CP-PACS/2048
1997,1068000000000,ASCI Red
1997.5,1338000000000,ASCI Red
1999,2121000000000,ASCI Red
1999.5,2379000000000,ASCI Red
2000.5,4938000000000,ASCI White
2001,7226000000000,ASCI White
2002,35860000000000,Earth-Simulator
2004.5,70720000000000,BlueGene/L beta-System
2005,136800000000000,BlueGene/L
2005.5,280600000000000,BlueGene/L
2007.5,478200000000000,BlueGene/L
2008,1026000000000000,Roadrunner
2008.5,1105000000000000,Roadrunner
2009.5,1759000000000000,Jaguar
2010.5,2566000000000000,Tianhe-1A
2011,8162000000000000,K computer
2011.5,10510000000000000,K computer
2012,16324800000000000,Sequoia
2012.5,17590000000000000,Titan
2013,33862700000000000,Tianhe-2A
2016,93014600000000000,Sunway TaihuLight
2018,122300000000000000,Summit
2018.5,143500000000000000,Summit
2020,415530000000000000,Fugaku
2020.5,442000000000000000,Fugaku
2022,1102000000000000000,Frontier
|
Conditions d’utilisation
Moi, en tant que détenteur des droits d’auteur sur cette œuvre, je la publie sous la licence suivante :
Ce fichier est disponible selon les termes de la licence Creative Commons Attribution – Partage dans les Mêmes Conditions 3.0 (non transposée).
- Vous êtes libre :
- de partager – de copier, distribuer et transmettre cette œuvre
- d’adapter – de modifier cette œuvre
- Sous les conditions suivantes :
- paternité – Vous devez donner les informations appropriées concernant l'auteur, fournir un lien vers la licence et indiquer si des modifications ont été faites. Vous pouvez faire cela par tout moyen raisonnable, mais en aucune façon suggérant que l’auteur vous soutient ou approuve l’utilisation que vous en faites.
- partage à l’identique – Si vous modifiez, transformez, ou vous basez sur cette œuvre, vous devez distribuer votre contribution sous la même licence ou une licence compatible avec celle de l’original.
Historique du fichier
Cliquer sur une date et heure pour voir le fichier tel qu'il était à ce moment-là.
| Date et heure | Vignette | Dimensions | Utilisateur | Commentaire | |
|---|---|---|---|---|---|
| actuel | 22 février 2023 à 02:40 | | 800 × 600 (49 kio) | Tga.D | updated data, fixed colors and styles to be more color blind-friendly |
| 7 mars 2022 à 18:11 |  | 800 × 600 (37 kio) | Daemon2010 | Added Fugaku | |
| 20 février 2019 à 08:32 |  | 800 × 600 (45 kio) | Tga.D | Increase font size; adjust label positions | |
| 20 février 2019 à 08:15 |  | 800 × 600 (45 kio) | Tga.D | Regenerated with a newer version of gnuplot, and more recent TOP500 data. Opted to not update the trendline, as the divergence from expected seems more relevant. | |
| 19 juin 2013 à 00:20 |  | 800 × 600 (34 kio) | Tga.D | New #1 on the TOP 500 June 2013 list. | |
| 24 décembre 2012 à 03:07 |  | 800 × 600 (34 kio) | Tga.D | large mediawiki-generated png versions had messed up spacing in the key, switching the order to see if it fixes it | |
| 24 décembre 2012 à 02:29 |  | 800 × 600 (34 kio) | Tga.D | User created page with UploadWizard |
Utilisation du fichier
Les 2 pages suivantes utilisent ce fichier :
Usage global du fichier
Les autres wikis suivants utilisent ce fichier :
- Utilisation sur ar.wikipedia.org
- Utilisation sur bs.wikipedia.org
- Utilisation sur ca.wikipedia.org
- Utilisation sur en.wikipedia.org
- Utilisation sur es.wikipedia.org
- Utilisation sur fa.wikipedia.org
- Utilisation sur gl.wikipedia.org
- Utilisation sur he.wikipedia.org
- Utilisation sur hu.wikipedia.org
- Utilisation sur id.wikipedia.org
- Utilisation sur ja.wikipedia.org
- Utilisation sur ru.wikipedia.org
- Utilisation sur th.wikipedia.org
- Utilisation sur uk.wikipedia.org
- Utilisation sur zh.wikipedia.org